
Google Analytics for eCommerce is one of the most important elements of successful sales. Correctly configured analytics will answer most questions related to traffic, customers, channel profitability or effectiveness of marketing activities. Nowadays it is hard to imagine any website without properly plugged in and constantly monitored analytics. Ultimately, all our actions are about the time and money spent, which should bring specific returns on investment. That is why it is so important to monitor, analyse and draw conclusions from the actions performed. This is not possible without correctly plugged in and configured Google Analytics tool.
The topic of Google Analytics is so wide that it would be difficult for us to fit everything into one article. If you are interested in exploring the tool in more detail, below are links to the knowledge base in the form of articles and videos from Google.
Link to the Google help database, or to the YouTube channel where all the modules and issues related to GA are discussed.
In the following article, we will focus on those elements that are key to running an online shop. We will select and discuss in more detail specific modules from the 5 main reports, which are: real time, audience, acquisition, retention and conversion. The article is dedicated to intermediate users. I invite you to read it!
What is Google Analytics for eCommerce used for?
Google Analytics for eCommerce has several main areas. The tool has been divided into sections (reports), while each report is responsible for one specific area of website monitoring:
Real time (real time)
Who is currently visiting my store? Which page is currently most visited? Is the campaign I’m implementing at the moment effective – is it generating traffic? Where is the traffic coming from at any given time? What are the conversions at the moment?
Audience (Audience)
Who visits my shop? How old is he? What is her gender? What are his interests? What devices does the website visit from (mobile, desktop, tablet)? What browsers does the website access from (chrome, safari, Samsung internet)?
The places from which the user entered the website (Acquisition)
From which channel did it come to the store’s website (Organic, Social, Direct, Referral)? What were the traffic sources (Referral / Ceneo, Social / Facebook, Organic / Google)? What were the direct results from the Google Ads campaign? What are the impressions in the organic search results of Google Search Console?
User behaviour (Behaviour)
Which pages are most visited? Which products are most often bought? The most frequently searched terms in the online store? How fast does my site load on different browsers?
Actions performed on the website (Conversions)
Goals carried out by users on the website (e.g. purchase, subscription to the Newsletter, download of an e-book). The course of the entire customer purchasing path. How effective is the product? Which products are chosen the most and which convert best? What are multi-channel funnels?
Each section gives us key information in the context of analytics. About how to measure reports and which of them are most useful in the context of eCommerce below.
How to implement and correctly configure a Google Analytics for eCommerce?
The implementation of Google Analytics for eCommerce is most often performed by uploading the tracking code in the head of the website. Below is an instruction on how to implement the tracking code in Open Source systems with access to the head of the page and for two eCommerce systems, SaaS Shopify
Administration (1) → Property (2) → Tracking Info (3) → Tracking Code (4)
![]()
Tracking Code:
<!– Global site tag (gtag.js) – Google Analytics –>
<script async src=”https://www.googletagmanager.com/gtag/js?id=UA-138226469-1“></script>
<script>
window.dataLayer = window.dataLayer || [];
function gtag(){dataLayer.push(arguments);}
gtag(‘js’, new Date());
gtag(‘config’, ‘UA-138226469-1‘);
</script>
In place of the code UA-XXXXXXXXX-X, enter your own GA code.

After adding the code correctly, it is best to test the traffic immediately and its correctness using the “send test traffic” button. If Google Analytics receives the test traffic correctly, this is the information for us that the code implementation was successful. In the case of eCommerce systems such as Shopify, Shoper, we integrate through built-in modules in store engines, to which we upload the code in the format: UA-XXXXXXXXX-X.
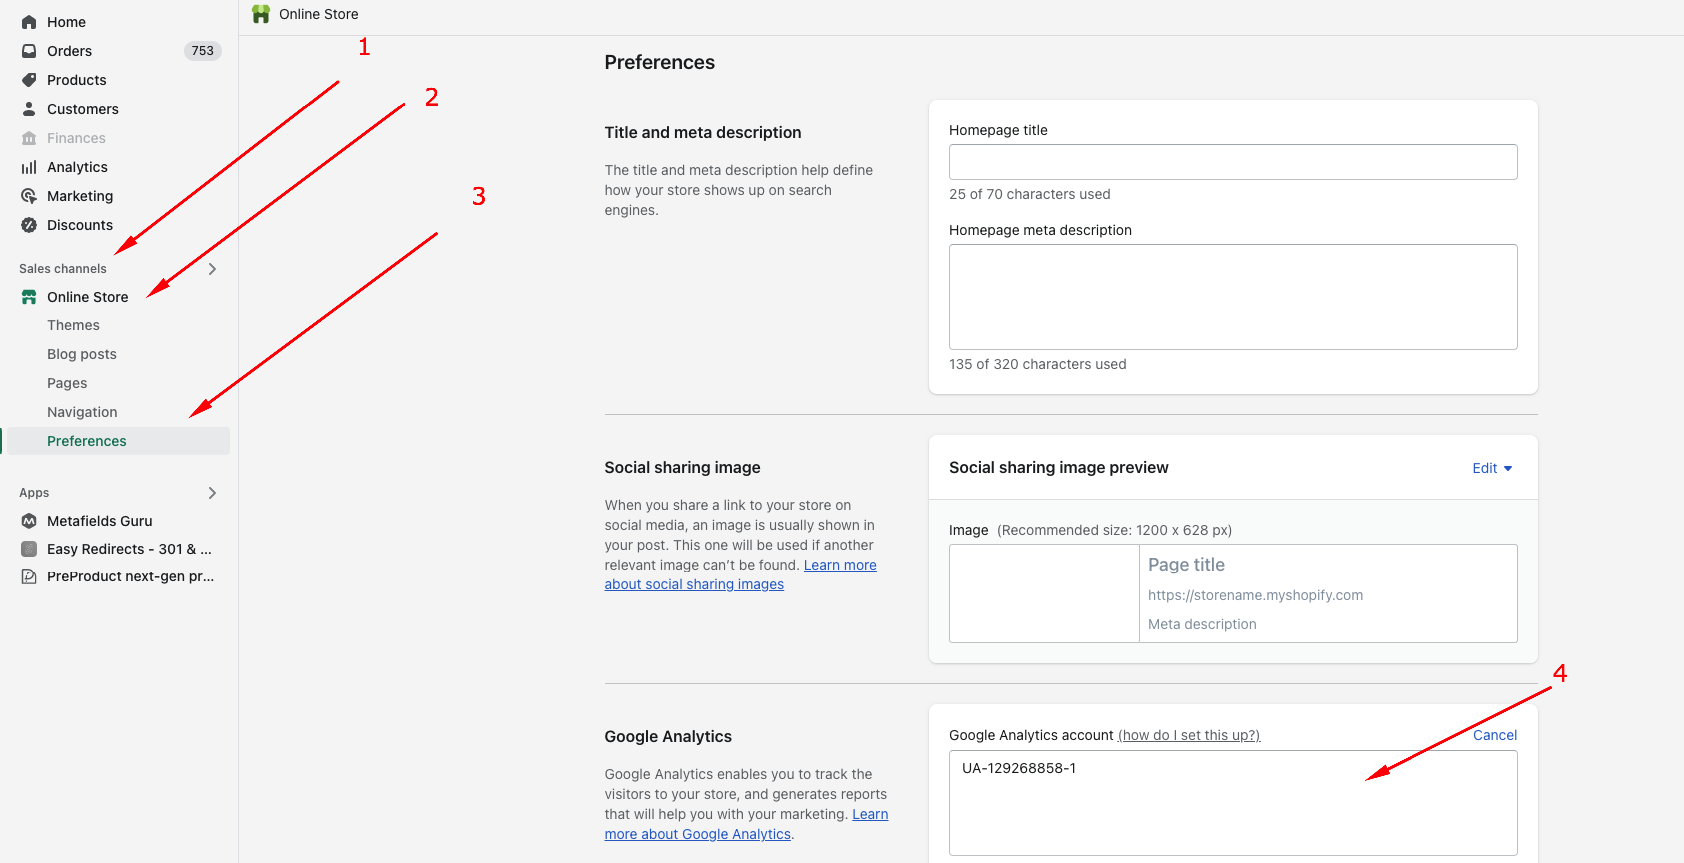
How to add Google Analytics code to Shopify?
Sales channels (online store) (1) → Preferences (2) → Google Analytics (3)
The last step after the tracking code has been correctly added and tested is the Google Analytics configuration. This is one of the key elements that allows you to properly track and monitor website traffic. The configuration should be performed primarily:
- Filters, exclude IP addresses, mail and payments as referring domains, configure traffic sources
- Set and configure goals and the shopping path
- Configure the eCommerce module
How to monitor data in Google Analytics for eCommerce?

As mentioned above, there are 5 main reports that Google Analytics has been built around which are Real Time, Audience, Acquisition, Behaviour, and Conversion. Here we will discuss the most important modules of each of the reports.
Google Analytics for eCommerce Realtime report
The report allows you to monitor users in real time. We get information about the source from which the users are coming, what page they are currently on and, in the case of eCommerce, at which stage in the sales funnel they are. The report works great during promotional campaigns or other marketing campaigns (eg. Black Friday, Sale, Christmas). Thanks to this, we can observe and monitor the course of the action in real time and catch any errors.


Real time → Overview
Current organic traffic broken down by medium, source, active users.
Real time → Locations
Information where the user comes from in relation to the country and region.
Real time → Site sources
Information from where the user now comes to our website, eg Organic / Google, Referral / Ceneo.
Real time → Content
Content that is currently being actively viewed.
Real time → Events & conversions
At which stage of the shopping cart or goal fulfilment the user is currently.
Google Analytics for eCommerce audience report

The recipient’s report is a treasury of knowledge about our clients. Thanks to it, we are able to verify who is the main recipient of our content, what interests they have, what country or city they come from, and many, many more. The analysis of recipients may result in a better understanding of their needs (age, sex, interests), adapting the appropriate offer, introduction of new products to the store, preparing appropriate marketing messages that are better suited to the age group of our recipients.

Audience → Overview
Report of all recipients, taking into account the number of users, sessions and pageviews. In the report, we also receive information about returning and new users.
Audience → Demographic data
The module presents the age and gender of recipients, along with data visualisation.
Recipients → Interests
User interests, e.g. Food & Drink, Beauty, Lifestyle, Arts & Entertainment etc.
Recipients → Geographic data
Country, language, location (e.g. Poland, Polish, Zakopane).
Audience → Behaviour
Raport przedstawiający stosunek ilości nowych do powracających klientów, dzięki temu jesteśmy w stanie stwierdzić jaki odsetek klientów powraca do sklepu lub jaka jest rzeczywista długość życia klienta.
Audience → Technology
A breakdown of the browsers used by users.
Recipients → Mobile traffic
The share of mobile devices in all traffic.
Google Analytics Acquisition Report
One of the most visited places in Google Analytics, where we analyse sales revenues, conversion rate, number of transactions and traffic channels. In the acquisition report, we also link Google Ads and Google Search Console accounts. Thus, we verify all types, results of paid campaigns, keywords – Google Ads and reports of organic search results – Google Search Console from one place. It is one of the most comprehensive and potentially data-analytical reports in the entire GA.

Acquisition → All traffic
A module that monitors key indicators such as the number of users, number of sessions, conversion rate, transactions and revenues.
Acquisition (1) → All Traffic (2) → Channels (3)

Not all of these data are always clear. We often wonder what a session is and how long it lasts, what is the bounce rate or the average session duration. Therefore, we will try to clarify these issues at this point.
Session – is a group of user interactions that occur on your website in a given period of time. For example, one session can include several pageviews, events, social interactions and eCommerce transactions. A session can be imagined as a reservoir for all the activities that a user takes on your site. One user can have multiple sessions.
There may be another session right after the end of one session. There are 2 ways to end a session:
Time dependent expiry:
- after 30 minutes of inactivity
- midnight
Campaign change:
- If a visitor arrives under one campaign and returns after leaving the site under a different campaign.
Average session duration – average time spent by all users on one session.
Bounce – Session on the site that boils down to displaying one page. Only a single request is made to be rejected. In the described case, it is displaying the page and then leaving it without triggering additional events on the page (server-side requests).
Bounce rate = number of bounce sessions / total number of sessions
More information on what are the key KPIs in eCommerce and how to analyse them can be found here (link).
Acquisition → Google Ads
A module that allows you to measure all created campaigns in your Google Ads account. Thanks to the link with Google Analytics, we get all the key parameters of campaign settings at hand, such as cost, users, clicks, CPC, transactions or revenues.
Acquisition → Search Console
A great place where we can immediately verify a number of data in relation to organic traffic. The key parameters are entry pages, page views on Google, clicks, CTR, number of transactions, revenues, and conversion rate.

Acquisition → Social
A module presenting data from a source which are social networks. Divided into Facebook, Facebook Stories, Instagram, Instagram Stories, Twitter etc. We receive information about the number of sessions, traffic, conversions and revenues for each source. For online stores that mainly generate traffic from social networks, it is a necessary module for data analysis.
Acquisition → Campaigns
Here we will find data from the campaigns that have been created. For example, we create campaigns for our product in cooperation with a well-known blogger. We provide a specially created URL for pasting, redirecting to our store’s website. To monitor the results of the (collaboration) campaign in detail, the URL should contain relevant data such as the name of the campaign, source and medium. The prepared URL is called UTM. UTM, you can prepare on the basis of a ready-made tool available here: https://landingi.com/pl/utm-builder/
Behaviour report in Google Analytics
Behaviour is another important report. Talking about how the user interacts with the website, which content is most interesting for him, etc. The Behaviour Report allows you to answer the following questions, for example: Which pages are most viewed? How long did the user stay on our website? Where did he leave the page? How fast do items on our website load? What changes occur in user behaviour and many, many more.

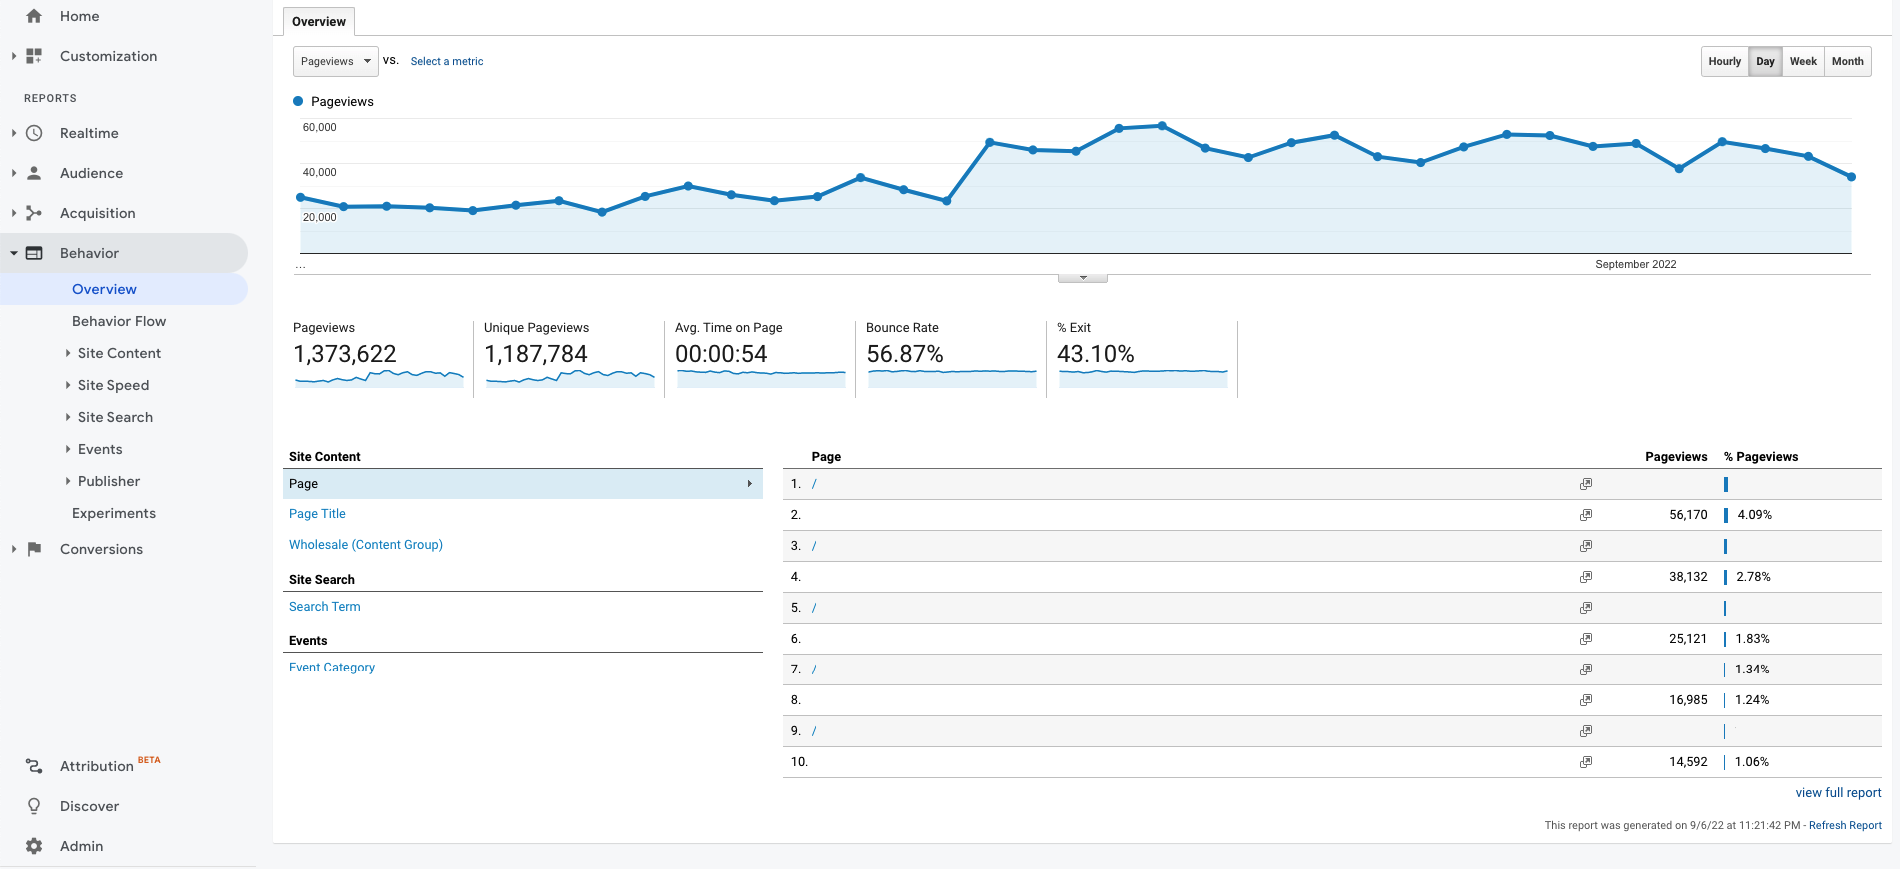
Behaviour → Overview
Here we find the basic parameters of user behaviour. Number of pageviews, unique pageviews, average time spent on our website, bounce rate and percentage of exits.
Behaviour → Changes in behaviour
It is a convenient, detailed flow of behaviour, illustrating the places and types of interactions performed by users on the website. From here you will find out what the start pages were, all user interactions and on which page the session ended.
Behaviour → Site content
A place that allows you to monitor the basic indicators of user engagement on our website. In short – it is the information which page is responsible for the greatest number of page views, number of entries, number of exits and the value of this page.
Behaviour → Site Speed
The report shows the average page load time for different browsers and the total load time for each page. It allows you to answer the questions: for which browsers the page loads too slowly and requires improvement? What is the loading time of individual pages and which pages require improvement, optimization of images, files, etc.
Behaviour → Events
Events are user interactions with content that we measure regardless of page or screen loading. We can divide them, among others, into downloads, clicking links, sending forms and playing movies. The report also allows you to monitor event pages, the most common events or the course of events.
Google Analytics for eCommerce conversions report
The last of the main reports available in Google Analytics Universal and thus one of the most relevant reports in relation to eCommerce. Thanks to it, we are able to answer the following questions: How are our goals being achieved? What does the flow and achievement of goals look like? What is the effectiveness of the products? Which products are selling the best? What do multi-channel funnels look like? How do the channels interpenetrate?
What do assisted conversions look like? The conversions module is so important and extensive that it requires more detailed discussion in a separate article. Here we will focus only on a few of the most important elements of the report.
Conversions → Goals
The main goals defined in eCommerce are the course and execution of the transaction. The flow of goals can be defined as follows:
(1) Adding a product to the basket → (2) Accepting the regulations and going to the checkout → (3) Completing shipping data → (4) Choosing delivery → (5) Choosing payment → (6) Finalising the transaction (clicking buy button) → (7) Go to the bank’s website and pay for the order.
In the discussed case, we have about 7 steps, but their number will vary depending on the choice of the system, building the basket or defining the goals that we need. We are able to closely monitor the goals prepared in this way, e.g. through the tick flow tab.


Conversions → E-commerce
It allows you to analyse your purchasing activity. You’ll find product and transaction information, average order value, eCommerce conversion rate, time to purchase, and more. By analysing the report, we will be able to answer the following questions: which products sell best? What purchasing behaviours arise at the stage of order fulfilment? How effective is your product listing?
Conversions → E-commerce → Product Effectiveness
We receive one of the key information with regard to all eCommerce sales, i.e. what products generate which sales. Then this information can be used to create a strategy or complement complementary products.

Conversions → Multichannel paths
By selling online, we notice that customers are at different stages of their purchasing decisions. This means that some customers know exactly what product they are looking for, others are only at the stage of educating and comparing products, choosing a brand or solution, while still others are our regular customers and make purchases on a regular basis.
So how to measure this data, if in Google Analytics in the online store transactions are assigned to recent searches, campaigns or referring ads, and the purchase is made by the user who learned about our product from the Facebook Campaign, and completed the transaction 14 days later? by going directly to our website from the search engine? Assisted conversions will help you verify which traffic sources are influencing your conversion.
A common case I encountered were campaigns on Facebook that did not sell well, e.g. were on the verge of break-even. After excluding the campaign, we saw significant drops in revenues in other channels such as Organic, Direct and Referral. Which ultimately resulted in the restoration of the Facebook Ads campaign. After all, we did not want to lose the high profitability of the other sources. Therefore, we will use the Assisted Conversions report to monitor assisted conversions.
Conversions → Multi-Channel Funnels → Assisted Conversions
The most important reports in Google Analytics for eCommerce
Realtime
Real time → Overview
Real time → Content
Recipients
Audience → Overview
Audience → Audience
Audience → Demographics
Audience → Behavior
Audience → Technology
Acquisition
Acquisition → Overview
Acquisition → All Traffic → Channels
Acquisition → All traffic → Sources / medium
Acquisition → Google Ads
Acquisition → Search Console
Behaviour
Behaviour → Overview
Behaviour → Site content
Behaviour → Events
Conversions
Conversions → E-commerce
Conversions → Goals
Conversions → Multichannel paths
Summary
As you are well aware Google Analytics for eCommerce is a powerful combo that is currently setting trends in data analysis worldwide. Thanks to it, apart from standard indicators such as revenue, conversion, number of users, traffic sources, we have access to a whole lot of information about our customers. Accurate analysis supported by relevant, documented data can change a lot in the context of the perception of customers and the products we provide them with.
Therefore, for effective data analysis in eCommerce we do not need full knowledge of Google Analytics. On a day-to-day basis, the few key reports you can find above will suffice. I hope you found the article useful and that it helps you better understand Google Analytics and how much information it stores about our customers’ behaviour.
See also categories: Social Media in eCommerce | PPC Campaigns | Shopify technologies | eCommerce SEO | E-mail marketing | eCommerce project management | eCommerce marketing | eCommerce management | eCommerce development | eCommerce b2b | eCommerce automation | eCommerce analytics | Content marketing | Case Study eCommerce | News | Other